Affiliate eCommerce Operations Dashboard
Sole operator of an affiliate eCommerce business — and the analyst who instrumented it. One live Looker Studio dashboard became the operation's single source of truth, and the numbers it surfaced were not the ones anyone hoped for. That's exactly why it's here.
01The Setup
An affiliate marketing operation selling physical products in a cash-on-delivery market: I marketed the products, took the orders, and followed them through delivery — as the only operator on the business. No team, no handoffs, and initially, no instrumentation: order status lived in scattered messages and platform screens.
02What I Built
Live Looker Studio Dashboard
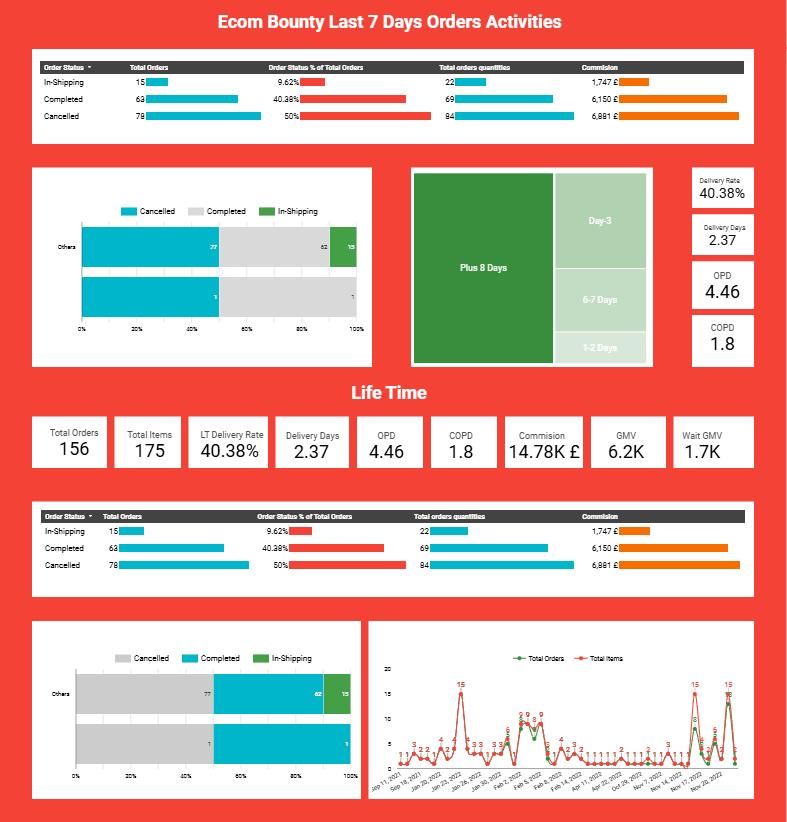
The operation's single source of truth: order lifecycle by status, delivery performance, and recorded commissions — checked before every daily decision, and readable in under a minute by a non-analyst.
SQL Directly on the Store Database
Queries written directly against the WooCommerce database — the same discipline used on production marketplace tables, applied to a small business: define the metrics, own the data model, then visualize.
End-to-End Ownership
Data model, metric definitions, and the dashboard itself — one person owned the pipeline from raw order rows to the decision screen.
Built for an Operator, Not an Analyst
The design target was reading speed: today's orders, their statuses, and what needs chasing — before the first coffee, not after an export.
03What the Numbers Said
The dashboard's headline discovery: of the 156 orders in the retained export, exactly half cancelled (78 of 156) before completing delivery. In a cash-on-delivery affiliate model, that isn't a footnote — it's the difference between a business and an expensive hobby. Instead of burying the number, the dashboard put it front and center: cancellation became a tracked, decomposed, daily-visible metric.
04Why This Case Is in the Portfolio
This is the only portfolio piece running on my own operational data, live, with real — and imperfect — numbers. It demonstrates the full loop most analyst portfolios only describe: run an operation, instrument it honestly, read the uncomfortable result, and let the data drive what happens next.
Open the live dashboard ↗Looker Studio overview page
(or embed via iframe)assets/affiliate-dashboard-overview.png